ETS matters: Looking on the bright side of the Field Measurement Approach
Stuart Orme, New Zealand Tree Grower February 2017.
The end of December 2017 marks the end of the Emissions Trading Scheme’s Commitment Period 2. All owners of ETS-registered forests planted after 1989, along with Permanent Forest Sink Initiative forests, are required to submit an emissions return by the end of June 2018. The emissions returns will be based on the change in carbon stocks between the last emissions return and the end of December 2017.
Owners of forests which are less than 100 hectares have to use the MPI’s look-up tables when completing their emissions return. These tables provide average data which is based on forest type, age, and in the case of radiata pine, the growing region. Submitting an emissions return using the look-up tables is almost always a desk-based, on-line exercise, and should not be too onerous, although accuracy is required to avoid over claiming and subsequent penalties.
However, owners of forests over 100 hectares, are required to use the Field Measurement Approach (FMA) to estimate changes in their carbon stocks. This is a multi-stage process, and involves measuring a series of sample plots across the forest, the exact location of which is pre-determined by MPI. The plot data is then used to provide individual owners with their own specific tables, and the emissions return must be completed using these tables.
For most small-scale foresters in this category, the FMA will involve employing a consultant and forest inventory crew to carry out the field work and submit the return. This can, at first glance, seem to be an expensive exercise, especially for owners with forests in the low hundreds of hectares because of the high intensity of plotting in smaller areas of forest. The plotting intensity is worked out according to statistical formulae provided and shown in the tables below.
| Size of forest in hectares | ||||
|---|---|---|---|---|
| 100 | 500 | 1000 | 2000 | |
| Number of plots | 30 | 50 | 64 | 84 |
| Size of forest in hectares | ||||
|---|---|---|---|---|
| 100 | 500 | 1000 | 2000 | |
| Indicative costs per hectare | $80 to $100 | $25 to $35 | $15 to $25 | $10 to $15 |
Therefore, a forest owner with 120 hectares of forest could be faced with a bill of over $10,000 for the work of estimating the carbon stocks. However, it is not all bad news.
Looking on the bright side
If you are facing the prospect and expense of FMA work in 2017 we can reassure you that, in our experience, many forest owners have been pleased they have had to go through the process. This is because the MPI data is general, and using measuring plots is the only way to accurately gauge the total carbon stored and the variation between different compartments or woodlots.
Of more immediate benefit to forest owners, in the lower North Island at least, is that we have found that many small forests are performing well above the MPI look-up table standards. Owners have far more carbon in their forests than they may realise.
Comparing examples
Woodnet is involved in regular FMA forest inventory work. The two graphs below use data taken from what we would consider to be typical radiata pine forests in the southern North Island. They provide a useful illustration of the rates of carbon sequestration per hectare each year in different forests and with different growing regimes.
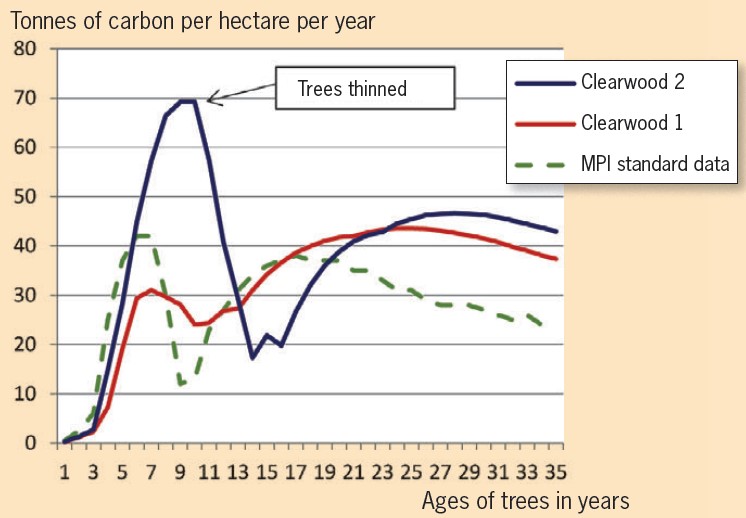
The graph above illustrates a number of items of interest to forest owners −
- How carbon capture or sequestration profiles and total quantities of carbon stored can vary between sites. The two clearwood regimes have different profiles which are a result of site and management differences including higher rainfall and later thinning
- How rapidly sequestration rates increase after establishment, and peak at around 10 to 14 years
- How thinning causes a significant dip in sequestration rates
- The low standard values produced by MPI and the value of owners undertaking their own inventory
- With the understanding of how carbon is sequestered and accounted for, we can implement silviculture regimes which maximise the amount of carbon that a forest owner can benefit from.
The graph above illustrates clearwood production in which trees are pruned and thinned. However, the graph below shows the growth and carbon capture profile of two forests grown under a no prune regime, and gives a good illustration of the effect of thinning on carbon capture sequestration rates.
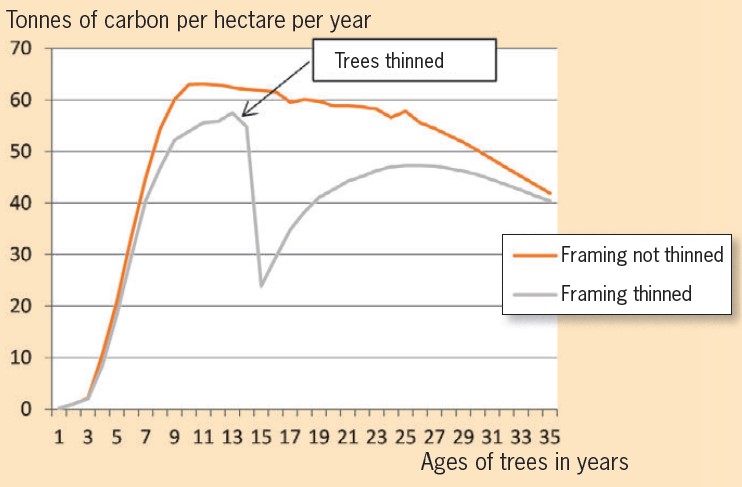
The data also provide us with a picture of the total carbon, and the average carbon being sequestered by the trees over typical 25 to 35 year rotations. It is summarised in the table below.
| Regime | Forest type | Total tonnes carbon per hectare | Average tonnes carbon per hectare per year | ||
|---|---|---|---|---|---|
| Age 25 | Age 30 | Age 25 | Age 30 | ||
| Framing no thinning | Dry coastal | 1,193 | 1,458 | 47.7 | 48.6 |
| Framing no thinning | Hill country inland | 1,217 | 1,730 | 48.7 | 57.6 |
| Framing with thinning | Dry coastal | 916 | 1,149 | 36.6 | 38.3 |
| Clearwood | Hill country inland | 729 | 1,344 | 29.2 | 44.8 |
| Clearwood | Hill country inland, thinned late | 890 | 1,136 | 35.6 | 37.9 |
| MPI standards | Hawkes Bay and southern North Island | 712 | 978 | 28.5 | 32.6 |
| Extra carbon over and above MPI standard | 729 minus 712 = 17 tonnes per hectare |
| Total extra carbon in 120 hectares | 17 times 120 hectares = 2,040 tonnes |
| Total value of extra carbon at current price of $17.25 a tonne | 2,040 times $17.25 = $35,190 |
The table also confirms that −
- All of our example typical forests out-perform the MPI standards
- Framing regimes, especially if they are left un-thinned, are likely to be the highest performing in terms of carbon yields.
As an aside, the data also suggests that growers should look at the timing of carbon benefits as well as timber yields when planning harvesting age. Older forests continue to sequester significant amounts of carbon.
Happy to pay
Going back to our 120-hectare forest owner, unhappy about the cost of the mandatory exercise of having to select and measure sample plots. Even in the lowest performing of our example forests the cost of the work is easily covered by the extra value of carbon discovered by the FMA process.
By understanding the ETS, and with judicious management of New Zealand Unit balances, the forest owner should happily be able to pay for the forest measurement work by selling carbon he never knew he had before the process was undertaken. As we always say, having carbon in your account does give you options. You should also have a plan in place to manage the corresponding obligations which are associated with carbon sequestered by forests planted after 1989.
In summary
Forest owners with over 100 hectares of ETS registered forest have no choice but to undertake FMA plotting if they want to submit a return. We advise you get the process under way as soon as possible as it is likely that, as the year progresses, inventory crews may be fully booked. The field work should be completed, and acceptable data submitted to MPI, by 31 December although an extension may be allowed by MPI into the first two quarters of 2018.
| 31 December 2017 | FMA plotting work must be completed and data submitted to MPI at an acceptable standard. |
| 1 January to 30 June 2018 | All Mandatory Emissions Returns must be completed and submitted to MPI during this period. |
For owners who took the opportunity to leave the ETS a few years ago and who, in the light of improving carbon prices, may now be considering re-entry, it is not too late to do this. Carbon in the tress can be claimed up to the end of December by when re-entry applications need to be with MPI. For forests over 100 hectares we advise you begin this process immediately to get both the registration and the measurement process completed before to the cut-off date.
 Farm Forestry New Zealand